Improved access to trade charts
We have received a number of requests to improve access to the trade charts in users' backtests.
Our next release (due 8/14/2018) will include a number of changes to the way we display your backtest results.
New features
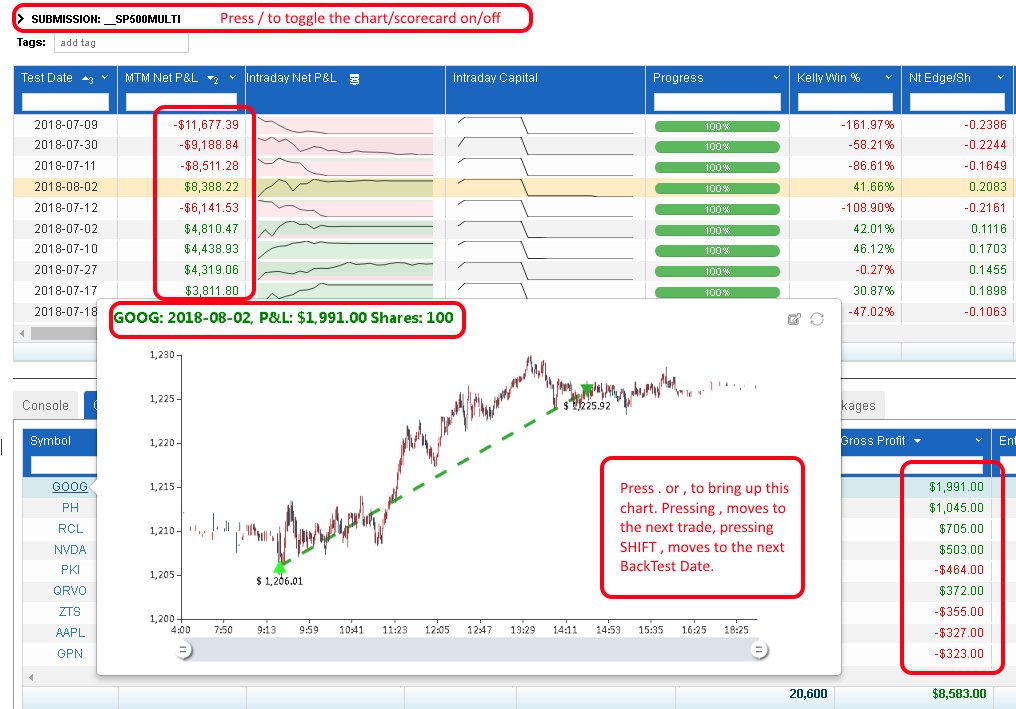
- When you access the results page for a backtest, rather than being sorted by date, the backtest will be sorted by the Absolute of your Net PnL
- When you select a backtest date the orders on that date will be sorted by Absolute Gross Profit so the biggest influencers will be at the top
- You can now toggle the Time series chart and Scorecard on and off by simply pressing the / key (just to the left of your Right Shift key)
- Press > and < (Shift . and Shift , ) to step through your trading days.
- Press . and , (Period and Comma) to step through your trades.
- We also preload the bar data for the next trade (the fetch of that data takes a few seconds to load so we felt this would improve the user experience)
- The charts are now 50% larger
- The color of the text at the top of the chart indicates if it was a winning or losing trade.
- The PnL and Position Size/Direction has been added to the top of the chart.
Hopefully you will find these changes useful and they will help speed your review of your backtest performance.
Paul
Tagged: