Using Technical Analysis to identify a Candlestick Pattern

Many people new to CloudQuant are interested in getting started in technical analysis to create a trading strategy.
There is an API included with CloudQuant called TA-LIB or Technical Analysis Library. TA-LIB will help you recognize many common Japenese Candlestick patterns. These work both with:
- Daily Bar Data
- One Minute Bar Data
For example, the Three Inside Up trading pattern looks like this:
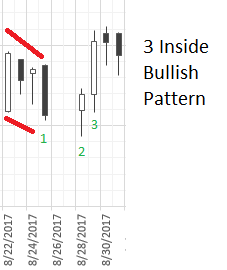
The three inside technical analysis patterns indicate a market reversal. To detect this pattern you need at multiple candles (time periods.) The first set of candles are used to indicate a trend and the last three are used in the determination of the pattern.
Bull Reversals (Moving from Downtrend to Uptrend) occur when:
- The market is trending down.
- The 1st candle is red or black and a large differential between open and close price. This is a candle where the time period had a higher open and lower close.
- The 2nd candle is green or white and a smaller differential between open and close price.
- The 3rd candle is green or white with a closing price above the close of the 2nd candle.
To see a full strategy that detects this technical pattern in both 1-minute bar data and in daily bar data look at this public script:
https://app.cloudquant.com/#/strategies?script=TALIB.Three_Inside
Sample Code - 1-minute bar data
from cloudquant.interfaces import Strategy
import ktgfunc
import talib
import numpy as np
import pandas as pd
from collections import OrderedDict
    def on_minute_bar(self, event, md, order, service, account, bar):

         # make sure we have at least one valid bar by not checking until we are one minute into the trading day.
        if service.system_time > md.market_open_time + service.time_interval(minutes=20, seconds=15):
            minute_bars = md.bar.minute(start=-20)

            # Get Open, High, Low, Clos (OHLC) data from the minute bars
            close = minute_bars.close
            high = minute_bars.high
            low = minute_bars.low
            open = minute_bars.open

            # Call the Candlestick 3 Inside function using TA-LIB
            # a negative number is a bearish(sell) signal and a positive is a bullish(buy) signal
            ThreeInside = talib.CDL3INSIDE(open, high, low, close)

            if ThreeInside[-1] != 0:
                print "{},Symbol={},Open={},High={},Low={},Close={},Signal={}".format(service.time_to_string(service.system_time), self.symbol, open[-1], high[-1], low[-1], close[-1], ThreeInside[-1])
Sample Code - daily bar data
from cloudquant.interfaces import Strategy
import ktgfunc
import talib
import numpy as np
import pandas as pd
from collections import OrderedDict
    def on_start(self, md, order, service, account):

        # symbol and timestamp
        print(self.symbol + ":  " + service.time_to_string(service.system_time))
        # Get 100 Days (1 year) of Daily Bars from CloudQuant
        daily_bars = md.bar.daily(start=-100)

        # Get Open, High, Low, Clos (OHLC) data from the daily bars
        close = daily_bars.close
        high = daily_bars.high
        low = daily_bars.low
        open = daily_bars.open

        # Call the Candlestick 3 Inside function using TA-LIB
        # a negative number is a bearish(sell) signal and a positive is a bullish(buy) signal
        ThreeInside = talib.CDL3INSIDE(open, high, low, close)

        # get the date values so we can output the OHLC with the Candlstick Signal
        dates = service._context.market._storage.market_hours.keys()
        dateList = []
        for date in dates:
            dateList.append(str(date.strftime('%Y-%m-%d')))
        dates = sorted(dateList, reverse=True)[1:101]
        dates.sort()

        #Place the results OHLC & Signal results into python dictionaries for nice output in a table
        dict = OrderedDict()
        dict['date'] = dates
        dict['open'] = open
        dict['high'] = high
        dict['low'] = low
        dict['close'] = close
        dict['3Inside'] = ThreeInside

        # Create a user data file so we can reference the data later.
        # This file will show up in the user data tab.
        #
        # NOTE: You can open these files and select all, copy, then paste directly into
        # MS Excel! A great way to see your data and manipulate it.

        self.filename = "signals_{}.html".format(self.symbol)

        #setup a title for the output table
        symbol = 'TA-LIB Signals: ' + self.symbol

        #print out an HTML table with the results
        print ktgfunc.talib_table(symbol, 1, dict)
        # write out the HTML document starting tags
        service.write_file(self.filename,"<html>")
        service.write_file(self.filename,"<body lang=EN-US>")
        # write out the html table with the data in it
        service.write_file(self.filename, ktgfunc.talib_table(symbol, 1, dict))
        # write out the html closing tags.
        service.write_file(self.filename,"</body")
        service.write_file(self.filename,"</html>")